Tutorial
Here we show two use cases for this package. Corner plots can be produced from either a dictionary or an MCMCChains instance. When using a dictionary, each value can be a vector (representing a single chain) or an array, where each column represents a chain. Below we create some mock values uniformly samples between zero and one, and add a weight. If the weight is not included, the package will weigh all samples equally.
using CornerPlotting
using CairoMakie
using Distributions

results = Dict(:a=>rand(500_000,3), :b=>rand(500_000,3), :c=>rand(500_000,3))
results[:weights] = results[:a].*results[:b]
500000×3 Matrix{Float64}:
0.0317487 0.18901 0.348616
0.00849414 0.0248861 0.478416
0.288745 0.204442 0.0254002
0.415902 0.645371 0.120476
0.516707 0.251156 0.0196906
0.0947639 0.107471 0.0406011
0.0458091 0.0718326 0.48393
0.236099 0.184818 0.192283
0.377743 0.265699 0.160414
0.00286934 0.189408 0.187326
⋮
0.247785 0.200112 0.110926
0.00835288 0.350434 0.757
0.053496 0.313125 0.386708
0.210434 0.0368263 0.0880904
0.121336 0.0536867 0.140062
0.593899 0.536613 0.0343859
0.183464 0.00489222 0.167877
0.341952 0.596438 0.273581
0.219916 0.164495 0.0657275We can then produce the corner plot. We use Makie as the plotting backend, and we provide a default theme.
set_theme!(CornerPlotting.default_theme())
corner_plot = CornerPlotting.CornerPlot(results,[:a, :b, :c])
corner_plot.fig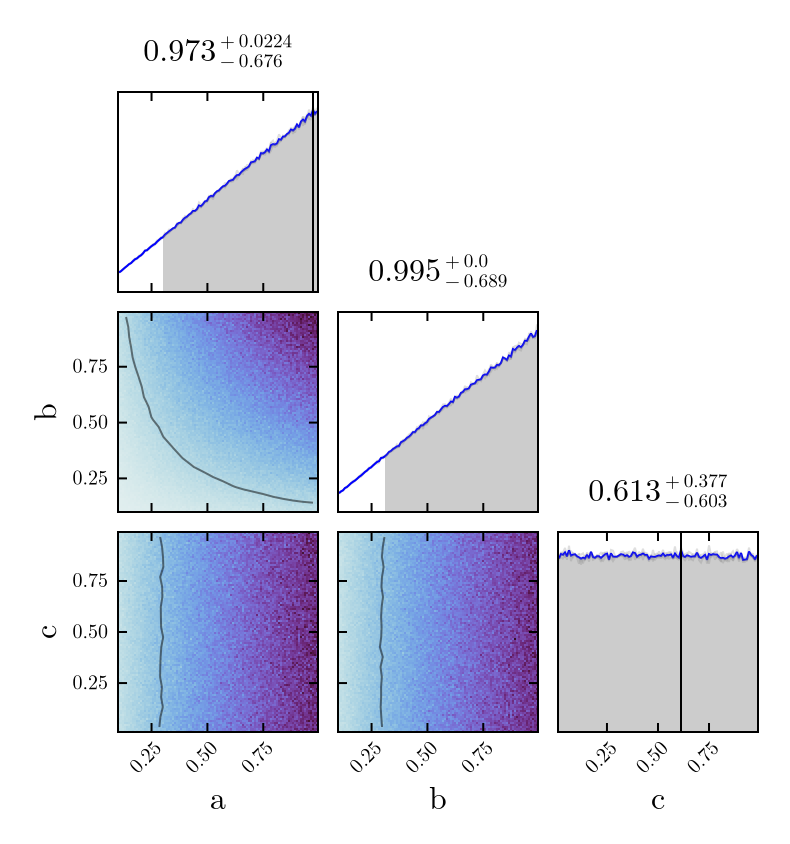
The plotter also works with MCMCChains produced with Turing.jl. The example below samples a few variables (two of them correlated) and then includes in the corned plot the sampled variables to verify we obtain the expected result. Model is sampled with 4 chains here.
using Turing
using Distributions

@model function test_MCMC()
    a ~ Normal(0.5,3)
    b ~ Normal(0.1, 5)
    x ~ MvNormal([1.0, 2.0], [1.0 0.5;0.5 1.0])
end

num_chains = 4
sampled_chains = sample(test_MCMC(), NUTS(), MCMCThreads(), 1000, num_chains)


corner_plot = CornerPlotting.CornerPlot(sampled_chains,[:a, :b, Symbol("x[1]"), Symbol("x[2]")])
CornerPlotting.plot_extra_1D_distribution(corner_plot, :a, Normal(0.5,3))
CornerPlotting.plot_extra_1D_distribution(corner_plot, :b, Normal(0.1,5))
CornerPlotting.plot_extra_1D_distribution(corner_plot, Symbol("x[1]"), Normal(1.0,1.0))
CornerPlotting.plot_extra_1D_distribution(corner_plot, Symbol("x[2]"), Normal(2.0,1.0))
corner_plot.fig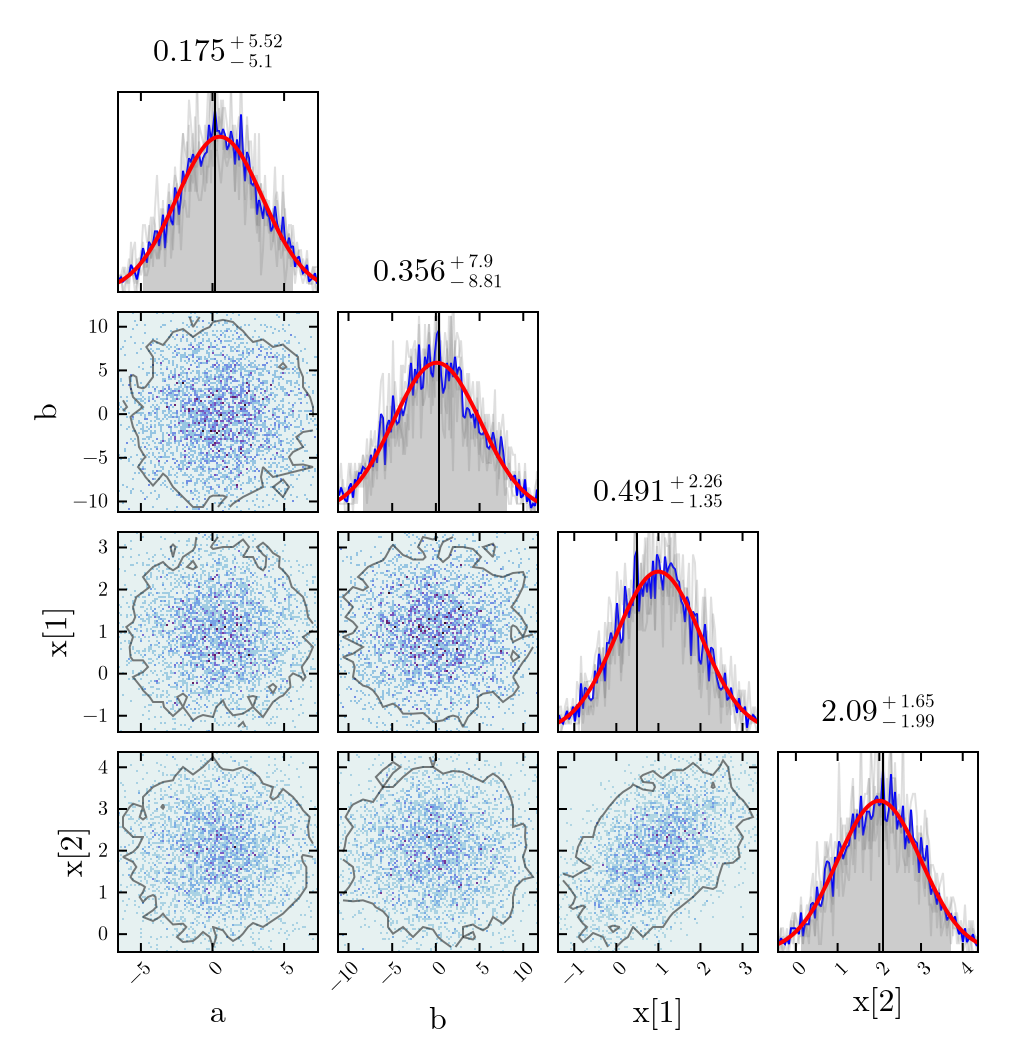
The same can be achieved when there is only one chain available
single_chain = sample(test_MCMC(), NUTS(), 5000)


corner_plot = CornerPlotting.CornerPlot(single_chain,[:a, :b, Symbol("x[1]"), Symbol("x[2]")])
CornerPlotting.plot_extra_1D_distribution(corner_plot, :a, Normal(0.5,3))
CornerPlotting.plot_extra_1D_distribution(corner_plot, :b, Normal(0.1,5))
CornerPlotting.plot_extra_1D_distribution(corner_plot, Symbol("x[1]"), Normal(1.0,1.0))
CornerPlotting.plot_extra_1D_distribution(corner_plot, Symbol("x[2]"), Normal(2.0,1.0))
corner_plot.fig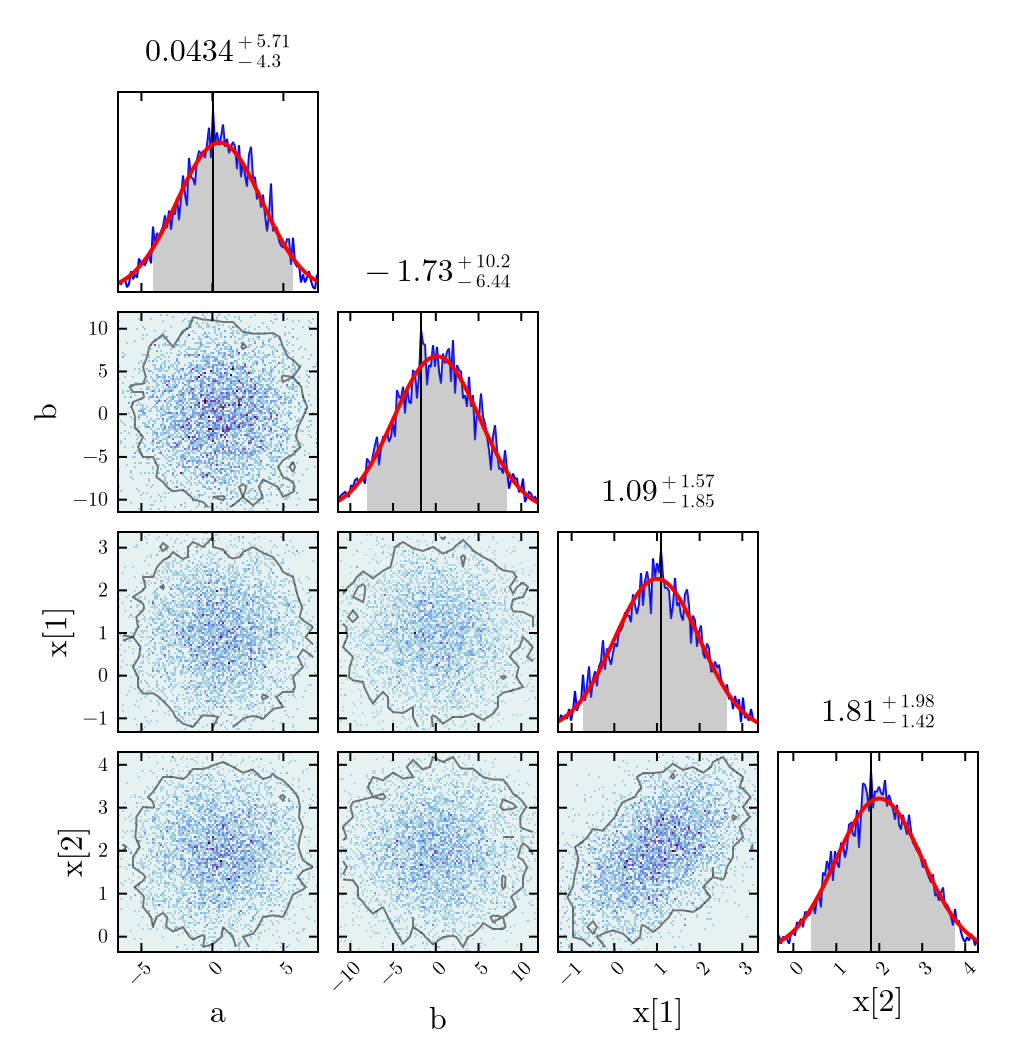
Additionally, all axes of the plot can be accessed from the CornerPlot struct. This allows us to add arbitrary content.
xvals = LinRange(-5.0, 5.0, 100)
yvals = LinRange(0.0, 0.1, 100)

axis_1d = corner_plot.distributions_1d[:a]
lines!(axis_1d, xvals, yvals)
axis_2d = corner_plot.distributions_2d[:a][Symbol("x[1]")]
scatter!(axis_2d, [0.0], [1.0], color=:red, markersize=30)

corner_plot.fig
Beware that in the example above you can access corner_plot.distributions_2d[:a][:b], but corner_plot.distributions_2d[:b][:a] is not defined. The first reference corresponds to the x-axis of the 2D marginalized distribution, while the second one corresponds to the y-axis, and a matching plot must be present in the figure.
It is also possible to plot multiple results in the same corner plot. Under the hood this calls the CornerPlot function repeatedly, hiding overlapping details such as the heatmaps. For the moment no credible intervals are shown in the 1D marginalized distributions, but these can be accessed via corner_plot.credible_intervals.
@model function test_MCMC()
    a ~ Normal(-2,3)
    b ~ Normal(4, 5)
    x ~ MvNormal([1.5, 1.0], [1.0 -0.5;-0.5 1.0])
end
sampled_chains_alt = sample(test_MCMC(), NUTS(), MCMCThreads(), 1000, num_chains)

corner_plot = CornerPlotting.MultiCornerPlot([sampled_chains,sampled_chains_alt, single_chain], [:a, :b, Symbol("x[1]"), Symbol("x[2]")])
corner_plot.fig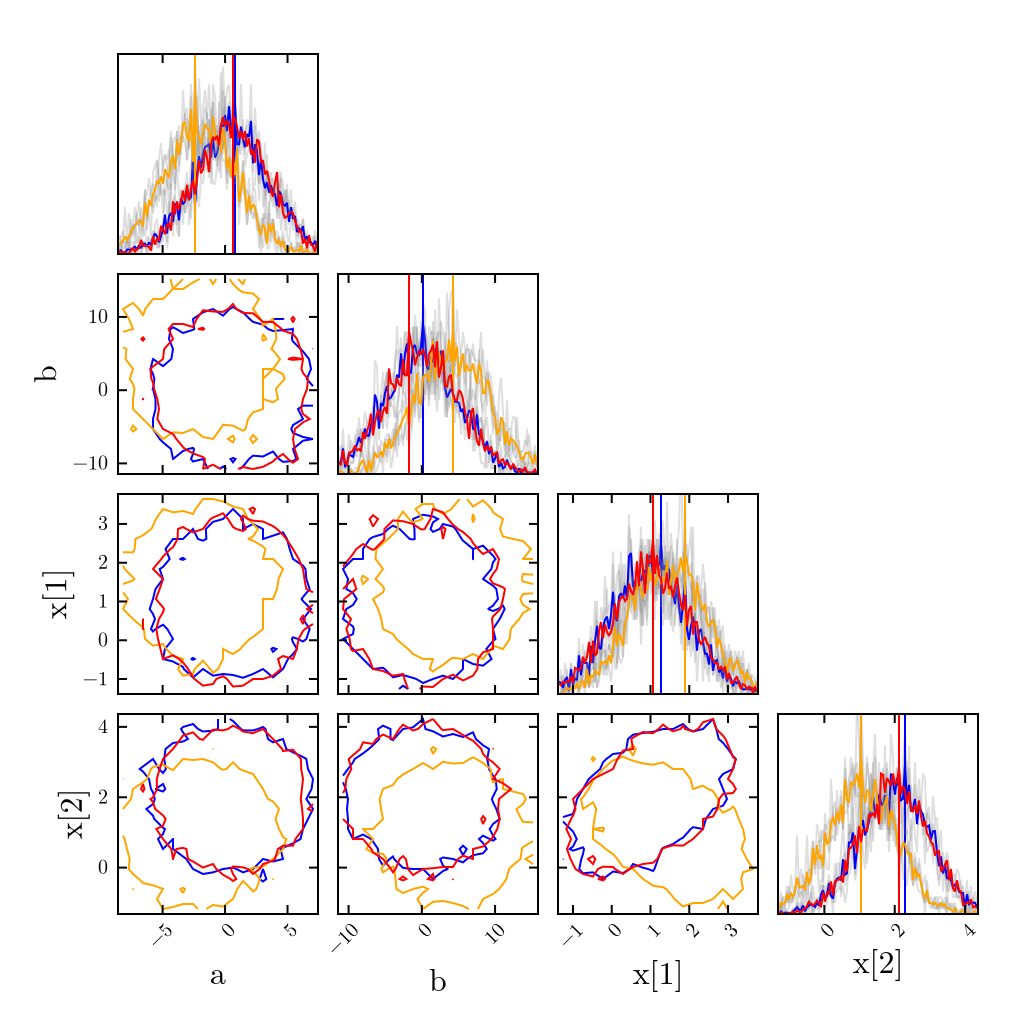
This page was generated using Literate.jl.